

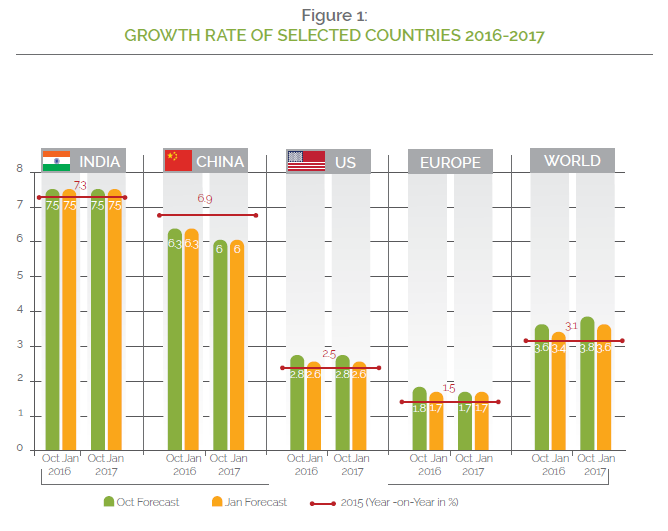
The world’s economic center of gravity is gradually shifting from the established wealthy economies to the emerging economies including India and is a seventh-largest economy with Gross Domestic Product (GDP) of more than US$2 trillion. Growing between 6% and 7% annually in the last few years, India has emerged as one of the world’s fastest-growing economies and an exciting investment destination. In fact, India is projected to be one of the three largest economies of the world by 2050. According to the International Monetary Fund, India’s growth is forecasted at 7.5% in 2016-17 despite the slower growth rate of China and rest of the world (Figure 1).
Due to the swift pace of development, the Indian economy has started to exploit the emerging market niche to cater its capital and funding requirements. This trend has led to a notable development in Islamic finance activities in India, especially in the Indian capital market. Even though India offers limited options for investors looking at Shari’a-compliant investments, this should not undermine the scope for Shari’a-compliant investment opportunities in the country.
The concept of Shari’a-compliant equities came to the forefront in India when India’s first Shari’a index, BSE-TASIS Shari’a , was launched in 2010. Presently in the Indian capital market, Bombay Stock Exchange (BSE) and National Stock Exchange (NSE) are the two largest as well as leading stock exchanges where Shari’a-compliant equities are listed and traded. BSE with more than 6,000 listed companies and NSE with around 1,700 listed companies are successfully facilitating the growth of the Indian economy by providing an efficient fund raising platform, including Shari’a-compliant funds. The huge spread of listed Shari’a-compliant companies gives fund managers a wider spectrum and flexibility to identify and invest in future growth sectors and companies.[Hence, India offers an attractive destination to investors from across the world who are looking at Shari’a-compliant investment opportunities.
Shari’a Screening Norms in the Context of India
Islamic equity market covers Shari’a-compliant shares of the companies that do not engage in activities that are considered haram (prohibited) in Islam. In addition, these companies should also pass the Shari’a screening norms pertaining to their financials, which include tolerance level of interest-bearing debt, interest-based income and earnings and receivables, cash and bank balances. Companies that do not comply with Shari’a norms related to their businesses and financials are declared prohibited for Shari’a-compliant investors. In principle, the Islamic equity market is characterized by the absence of interest-based transactions, doubtful transactions and the holding of shares in companies that deal in Shari’a-non-compliant activities or items.
Hence, from Shari’a-compliant investment point of view, the key element to equity funds is the screening criteria used to determine the status of the companies in which investment is to be made. This requirement for screening companies prior to investment is derived from the Shari’a principle that Muslims should not partake in any activity that does not comply with the teachings of Islam. At present, there are numerous screening methodology being developed and approved by renowned Islamic scholars that are being used by financial institutions around the world. Due to exigencies of modern business and particularly the pervasiveness of interest transactions, fully Shari’a-compliant equities are extremely rare. But to provide investors reasonably wide choices of Shari’a-compliant equities in the Indian market, Shari’a scholars have arrived at minimum compliance criteria. The Shari’a screening norms are related to:
- Sectors of the economy not permissible for Shari’a-compliant investment
- Those sectors in which investment is impermissible per se include conventional (interest-based) banking, conventional (interest-based) insurance, brokerage of conventional (interest-based) financial products and provision of fund-based financial services, manufacture, distribution and sale of potable alcoholic beverages and narcotics, processing, distribution and sale of pork and pork related products, gambling and tobacco; and
- Those sectors in which investment is prima facie not permissible in the Indian context till specific reliable information is available to the effect that the activities undertaken by the industry as a whole or a specific company in that industry is in accordance with the Shari’a. Such industries include all meat processing industries and units marketing such products, sugar manufacturing units, media broadcasting and entertainment industries, airlines and diversified companies; and
- Companies whose main line of business may not lie in any of the above but which may be involved in one or more of the above activities to some extent either directly
or indirectly.
- Financial parameters for Shari’a tolerant companies. The listed equities who qualify the above mentioned business screening criteria are put to further test on certain financial parameters, in order to qualify as acceptable for Shari’a-compliant investor(s), which are:
- total interest-bearing debt (including from all sources) and issued preference capital should not be greater than 25% of total assets;
- interest income from all sources and 8% of the interest-based investments should not exceed 3% of total income; and
- receivables plus cash and bank balance should not be greater than 90% of total assets.
The universe of the companies listed on BSE and NSE is regularly screened on the basis of above mentioned Shari’a screening norm. And the companies that pass the screening test are declared as Shari’a-compliant. It is to be noted that the list of Shari’a-compliant companies varies due to the fact that few of the companies that are declared Shari’a non-compliant during previous screening period may become Shari’a-compliant in the next screening and vice-versa. However, as per the information published by TASIS, there are more than 350 companies that are consecutively Shari’a-compliant during the period of 2011 to 2015.
Universe of Shari’a-Compliant Companies in India
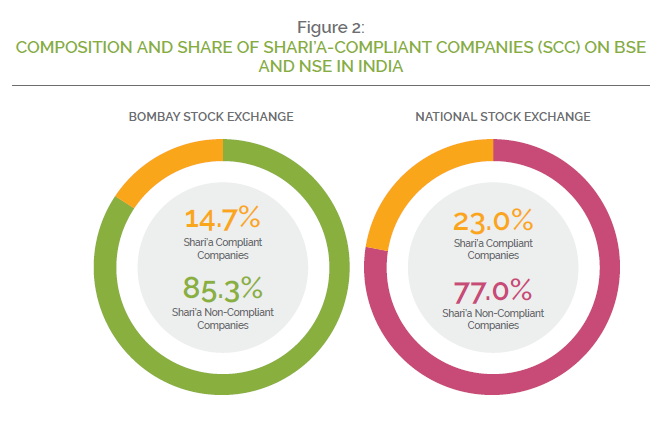
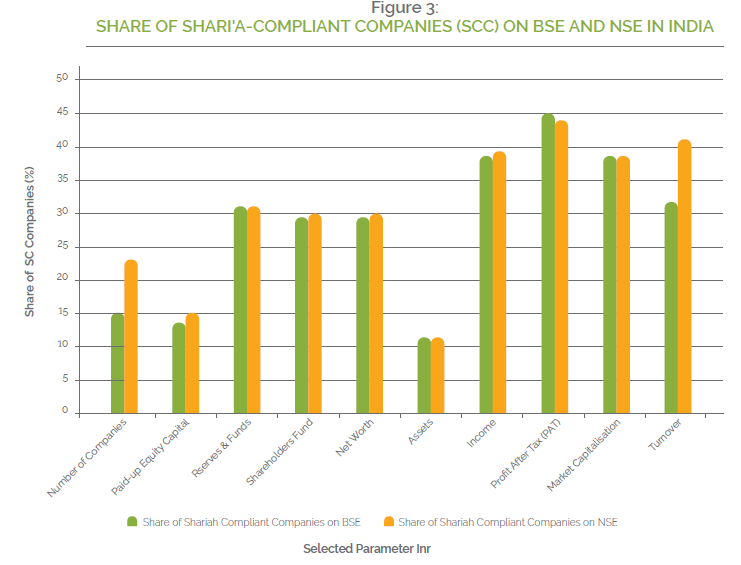
The Indian capital market is well regulated with 23 exchanges of which BSE and NSE are the two major stock exchanges and among the five largest in the world. Due to a large number of companies listed on the Indian stock exchanges and meeting Shari’a-compliance norms, India is looking like an interesting option for Islamic investors seeking an India exposure. As on November 30, 2015; of the 6,959 companies listed on BSE, 1,022 companies were Shari’a-compliant. There were 1,703 companies listed on NSE, of which 391 (or 23%) of the listed companies were Shari’a-compliant (refer to Table 1, Figure 2 and Figure 3).
| Exchange Name | Bombay Stock Exchange (BSE) | National Stock Exchange (NSE) | ||||
| Selected Parameter | Universe | SC | SC (%) | Universe | SC | SC (%) |
| Number of Companies | 6,959 | 1,022 | 14.7 | 1,703 | 391 | 23.0 |
| Paid-up Equity Capital | 3,296 | 428 | 13.0 | 2,247 | 342 | 15.2 |
| Reserves & Funds | 35,409 | 10,827 | 30.6 | 34,354 | 10,506 | 30.6 |
| Shareholder Fund | 38,311 | 11,232 | 29.3 | 36,279 | 10,841 | 29.9 |
| Net Worth | 38,054 | 11,226 | 29.5 | 36,111 | 10,835 | 30.0 |
| Total Assets | 195,546 | 22,305 | 11.4 | 187,688 | 21,548 | 11.5 |
| Income | 65,440 | 24,856 | 38.0 | 60,706 | 23,986 | 39.5 |
| Profit After Tax (PAT) | 3,501 | 1,585 | 45.2 | 3,471 | 1,539 | 44.4 |
| Market Capitalisation | 100,880 | 38,473 | 38.1 | 97,369 | 36,934 | 37.9 |
| Total Turnover | 29 | 09 | 31.3 | 284 | 118 | 41.4 |
COMPOSITION AND SHARE OF SHARI’A-COMPLIANT COMPANIES (SCC) ON BSE
AND NSE IN INDIA (IN INDIAN RUPEES BILLION)
An appraisal of the data (Table 1) shows that 14.7% of companies listed on BSE are considered as SCC with the market capitalization of INR 38,473 billion out of total market capitalization of INR 100,880 billion. The market capitalization of the Shari’a-compliant stock on NSE is INR 36,934 billion out of total market capitalization of INR 97,369 billion. In both stock 97,369 billion. In both stock exchanges, the share of market capitalization of Shari’a-compliant stocks accounts for about 38% of the total market capitalization.
| Selected Parameters | BSE (Indian Rupees Billion) | NSE (Indian Rupees Billion) | ||||
| SCC 2015 | Diff. | SCC 2014 | SCC 2015 | Diff. | SCC 2014 | |
| Number of Companies | 1,022 | 40 | 982 | 391 | 18 | 373 |
| Paid-up Equity Capital | 428 | 82 | 346 | 342 | 83 | 260 |
| Reserves & Funds | 10,827 | 2,994 | 7,833 | 10,506 | 2,945 | 7,561 |
| Shareholder Fund | 11,232 | 3,096 | 8,136 | 10,841 | 3,050 | 7,791 |
| Net Worth | 11,226 | 3,097 | 8,128 | 10,835 | 3,051 | 7,784 |
| Assets | 22,305 | 6,340 | 15,964 | 21,548 | 6,265 | 15,283 |
| Income | 24,856 | 9,066 | 15,790 | 23,986 | 8,907 | 15,079 |
| Profit After Tax (PAT) | 1,585 | 352 | 1,233 | 1,539 | 340 | 1,200 |
| Market Capitalisation | 38,473 | 4,384 | 34,089 | 36,934 | 4,232 | 32,703 |
| Turnover | 9 | 1 | 8 | 118 | 70 | 48 |
YOY DIFFERENCE IN COMPOSITION AND SHARE OF SCC ON BSE AND NSE
INDIA FOR THE PERIOD NOVEMBER 2014 TO NOVEMBER 2015
The data presented here reflects that about 15% and 23% of the total number of companies listed in the universe of BSE and NSE, the SCC share a notable percentage of the aggregate value of the universe. The sharing ratio, except in case of paid-up equity capital and assets, is higher than the sharing ratio of the number of SCC in the total universe.
Year-Over-Year (YOY) growth of Shari’a-Compliant Companies
As per the available data, in comparison to the previous year, the number of SCC listed on BSE increased from 982 in 2014 to 1,022 in 2015. This presents an annual (YOY) growth rate of 4.1% (see Table 2). On the NSE, the number of SCC listed in 2015 was 391, up from 373 in 2014.
Hence, analysis of the data shows that the number of companies complying with Shari’a principles has steadily grown in both exchanges. Similarly, both BSE and NSE recorded significant YOY growth in composition and share of SCC.
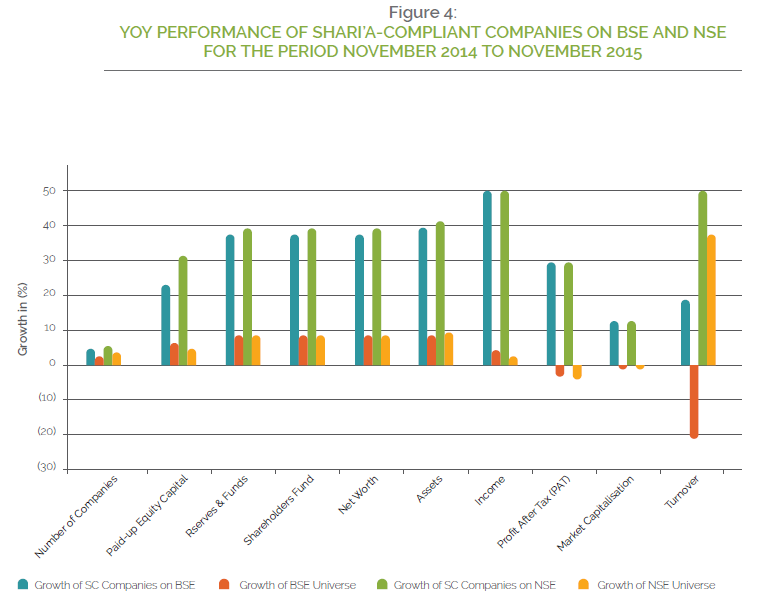
When compared with the growth of the universe (Table 3), SCC outperformed the universe. Two interesting observations are apparent. Firstly, the YOY growth of SCC on the selected parameters in both BSE and NSE has been higher than the YOY growth of their respective universe (see Table 4 and Figure 4). Secondly, in some parameters such as profit-after-tax, market capitalization and turnover where the YOY growth of the universe registered negative growth, the same parameters for the SCC have noted a positive growth.
| BSE (Indian Rupees Billion) | NSE (Indian Rupees Billion) | |||||
| Selected Parameters | Universe 2015 | Diff. | Universe 2014 | Universe 2015 | Diff. | Universe 2014 |
| Number of Companies | 6,959 | 158 | 6,801 | 1,703 | 55 | 1,648 |
| Paid-up Equity Capital | 3,296 | 184 | 3,113 | 2,247 | 83 | 2,164 |
| Reserves & Funds | 35,409 | 2,679 | 32,730 | 34,354 | 2,616 | 31,739 |
| Shareholder Fund | 38,311 | 2,851 | 35,460 | 36,279 | 2,769 | 33,509 |
| Net Worth | 38,054 | 2,854 | 35,200 | 36,111 | 2,782 | 33,329 |
| Assets | 195,546 | 15,491 | 180,055 | 187,688 | 15,043 | 172,645 |
| Income | 65,440 | 1,822 | 63,618 | 60,706 | 1,487 | 59,218 |
| Profit After Tax (PAT) | 3,501 | (89) | 3,589 | 3,471 | (97) | 3,568 |
| Market Capitalisation | 100,880 | (24) | 100,904 | 97,369 | (405) | 97,773 |
| Turnover | 29 | (8) | 37 | 284 | 76 | 208 |
YOY DIFFERENCE IN SIZE AND VALUE OF BSE AND NSE FOR THE PERIOD NOVEMBER 2014 TO NOVEMBER 2015
| Selected Parameters | SCC Growth on BSE for 2014- 2015 (%) | BSE Universe Growth for 2014- 2015 (%) | Diff. (%) | SCE Growth on NSE for 2014- 2015 (%) | NSE Universe Growth for 2014- 2015 (%) | Diff. (%) |
| Number of Companies | 4.1 | 2.3 | 1.8 | 4.8 | 3.3 | 1.5 |
| Paid-up Equity Capital | 23.8 | 5.9 | 17.9 | 31.9 | 3.8 | 28.0 |
| Reserves & Funds | 38.2 | 8.2 | 30.0 | 38.9 | 8.2 | 30.7 |
| Shareholder Fund | 38.0 | 8.0 | 30.0 | 39.1 | 8.3 | 30.9 |
| Net Worth | 38.1 | 8.1 | 30.0 | 39.2 | 8.3 | 30.9 |
| Assets | 39.7 | 8.6 | 31.1 | 41.0 | 8.7 | 32.3 |
| Income | 57.4 | 2.9 | 54.6 | 59.1 | 2.5 | 56.6 |
| Profit After Tax (PAT) | 28.5 | (2.5) | 31.0 | 28.3 | (2.7) | 31.0 |
| Market Capitalisation | 12.9 | (0.0) | 12.9 | 12.9 | (0.4) | 13.4 |
| Turnover | 18.1 | (20.5) | 38.6 | 145.9 | 36.3 | 109.7 |
DIFFERENCE OF GROWTH OF SC COMPANIES AGAINST THE GROWTH OF BSE
AND NSE FOR THE PERIOD NOVEMBER 2014 TO NOVEMBER 2015
Performance of Continuously Shari’a-compliant Companies (CSCC) in Market Indexes
The parameters selected to study the performance of SCC are: market capitalization, price-to-earnings ratio, dividend yield ratio and turnover. These parameters are selected with a view that they indicate the value of funds mobilized from the stock market and the returns offered to the investors (by the companies in the respective indexes, i.e. S&P BSE 500 and CNX 500). Comparative performance of continuously SCC in the indexes on the selected parameters shall also give a similar indication, thus giving a clearer picture of their market performance. In this case the performance is analyzed only for the CSCC.
S&P BSE 500 index is a broad representation of the Indian market. Consisting of the top 500 companies listed on BSE, the Index covers all major industries in the Indian economy. Out of 500 companies listed under S&P BSE 500 Index, 79 companies are CSCC, which is 15.8% of the total number of companies on the index.
As per the data available (monthly basis) for the period April 01, 2014 to March 31, 2015; the average market capitalization of CSCC is INR 274,140 million whereas the average market capitalization for total index is INR 177,102 million (see Table 5). This denotes that the average market capitalization of CSCC is 54.8% higher than the market capitalization of the Index. In terms of price-to-earnings (P/E) ratio, the ratio for CSCC is 45 times whereas the average P/E ratio for the Index is 110 times, a 59.3% higher than the P/E ratio of the CSCC. The average turnover of CSCC is INR 46 million whereas the average turnover for total Index is INR 55 million. This means that the average turnover of CSCC is 17.5% lower than the turnover of the Index. Based on the data presented in Table 5, one can deduce that the Index has outperformed CSCC, except in the case of average market capitalization.
| Selected Parameter | Unit | S&P BSE 500 Index | CSCC | CSC Diff. (%) |
| Average* Market Capitalisation | INR Million | 177,102 | 274,140 | 54.8 |
| Average P/E | Times | 110 | 45 | (59.3) |
| Average Yield | % | 1.35 | 1.09 | (19.1) |
| Average Turnover | INR Million | 0.89 | 0.73 | (17.5) |
PERFORMANCE OF CSC COMPANIES AGAINST S&P BSE 500 INDEX FOR THE
PERIOD APRIL 01, 2014 TO MARCH 31, 2015
| Selected Parameter | Unit | Index | Shari’acompliant | SC Diff. (%) |
| Average Market Capitalisation | INR Million | 171,345 | 269,658 | 57.4 |
| Average P/E | Times | 43 | 44 | 3.6 |
| Average Yield | % | 1.5 | 1.2 | -18.4 |
| Average Turnover | INR Million | 357 | 368 | 2.9 |
PERFORMANCE OF CSC COMPANIES AGAINST CNX 500 INDEX FOR THE PERIOD
APRIL 01, 2014 TO MARCH 31, 2015
When analysing the performance of CSCC on CNX 500 (NSE) Index, a different pattern emerges. The CNX 500 index consists of the 500 companies listed on NSE covering major industries in the Indian economy. Out of 500 companies listed under CNX 500 index, 77 companies were listed as CSCC. Table 6 shows performance of CSCC vis-à-vis the Index. As shown, the average market capitalisation of CSCC is 57.4% higher than the market capitalisation of the Index. CSCC had a P/E ratio of 44 times whereas the same ratio for the Index is 43 times. The average turnover of CSCC is 2.9% higher than the Index. Based on data in Table 6, CSCC had outperformed the Index in all parameters except for average yield where the average yield ratio of CSCC is 18.4% lower than the Index. In fact, the growth in the market capitalisation of these stocks in both BSE and NSE is more impressive than that of the indexes.
Year-to-Year (YTY) Performance Continuously Shari’a-compliant Companies (CSCC):
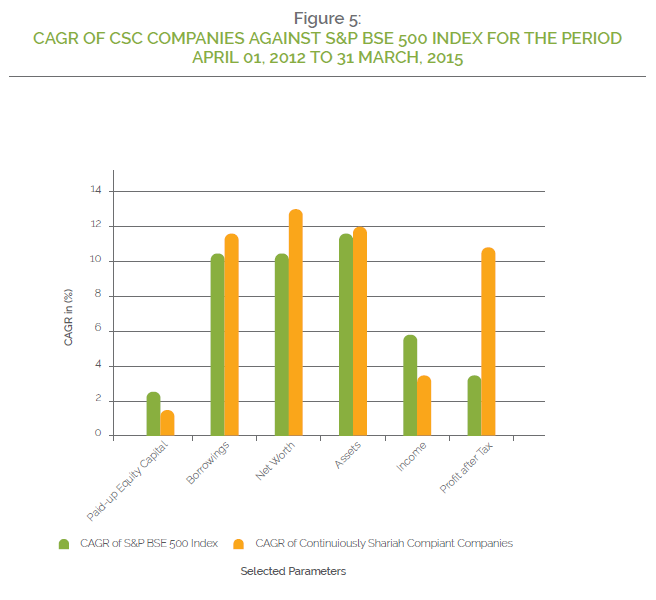
In order to have a better understanding of the performance of CSCC, annual growth is measured in terms of Compound Annual Growth Rate (CAGR). The parameters selected are paid-up equity capital, borrowings, net-worth, assets, income and profit after tax. These parameters are selected with a view that they indicate the financial health of the (companies in) indexes. The difference of CAGR of CSCC in the universe and CAGR of total universe on the selected parameters shall give a clearer picture of the financial health of the CSCC.
As evidence in Table 7 and Figure 5, the growth (CAGR) of CSCC on selected parameters on S&P BSE 500 index has been higher than the Index growth. Only in the case of paid-up capital and income that CSCC performed lower. The aggregate paid-up equity capital of CSCC for the period has grown with a CAGR of 1.2%, which is 1.3% lower than the growth rate of paid-up
equity capital of the total index. As for the growth rate of income, CSCC registered a slightly lower rate of 2.1% lower than the growth rate of income of total index. In terms of borrowings, net-worth, assets and profit after tax; CSCC had recorded growth rate of CAGR of more than 10%. The CSCC outperformed the index the most in the profit after tax with aggregate profit after tax grown with CAGR of 10.9%. It is 7.6% higher than the growth rate of profit after tax of total index which is 3.3%.
| Selected | Index | CSCC | Diff. in | ||||
| Parameters | As on 31.03.2015 | As on 31.03.2013 | CAGR % (2013-15) | As on 31.03.2015 | As on 31.03.2013 | CAGR % (2013-15) | CAGR (%) |
| Paid up equity capital | 1,636 | 1,557 | 2.5 | 114 | 111 | 1.2 | (1.3) |
| Borrowings | 34,375 | 28,201 | 10.4 | 1,456 | 1,166 | 11.7 | 1.3 |
| Net worth | 33,362 | 27,318 | 10.5 | 5,727 | 4,476 | 13.1 | 2.6 |
| Assets | 175,370 | 141,472 | 11.3 | 10,616 | 8,464 | 12.0 | 0.7 |
| Income | 53,314 | 47,772 | 5.6 | 9,597 | 8,947 | 3.6 | (2.1) |
| Profit after tax | 3,937 | 3,686 | 3.3 | 942 | 765 | 10.9 | 7.6 |
Table 7:
PERFORMANCE OF CSC COMPANIES AGAINST CNX 500 INDEX FOR THE PERIOD
APRIL 01, 2014 TO MARCH 31, 2015 (INDIAN RUPEES BILLION)
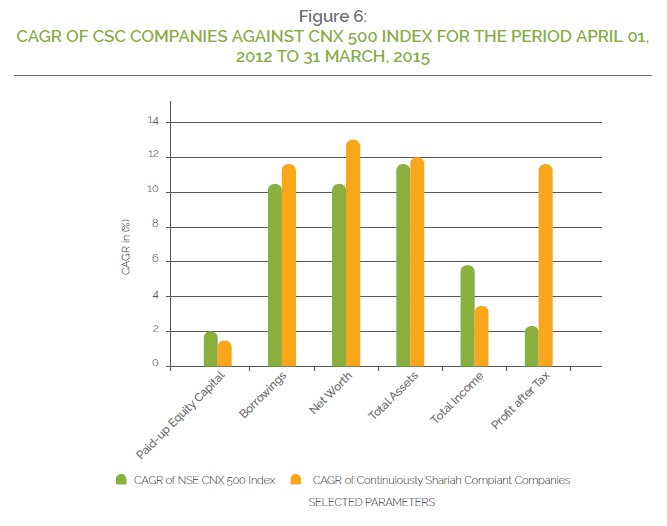
Similar to the performance of CSCC on the S&P BSE 500 index, CSCC listed on the CNX 500 index outperformed the growth rate of all parameters of the index except for paid-up equity capital and income (see Table 8 and Figure 5). The growth rate of paid-up equity capital of CSCC is 0.7% lower than the total index whilst the growth rate of aggregate income of CSCC is 2.2% lower than the growth rate of income of total index. Again, the aggregate profit after tax of CSCC outperformed the index in terms of CAGR by recording an 8.8% higher than that of the index.
Based on the analyses above, it could be concluded that Shari’a-compliant stocks available in the Indian market offer better return on investment and tend to outperform the market. This clearly proves that although the universe of all listed stocks is large as compared to that of Shari’a-compliant stocks, but in terms of performance and growth it ranks below the Shari’a-compliant stocks. Similar findings were given when all the listed stocks and Shari’a-compliant stocks were analyzed on the basis of profit-after-tax and net worth.
| Selected | Index | CSCC | Diff. in | ||||
| Parameters | As on 31.03.2015 | As on 31.03.2013 | CAGR % (2013-15) | As on 31.03.2015 | As on 31.03.2013 | CAGR % (2013-15) | CAGR (%) |
| Paid up equity capital | 1,506 | 1,447 | 2.0 | 115 | 112 | 1.3 | (0.7) |
| Borrowings | 33,190 | 27,139 | 10.6 | 1,454 | 1,163 | 11.8 | 1.2 |
| Net worth | 32,839 | 26,980 | 10.3 | 5,656 | 4,424 | 13.1 | 2.7 |
| Total Assets | 169,580 | 136,619 | 11.4 | 10,467 | 8,345 | 12.0 | 0.6 |
| Total Income | 51,588 | 46,285 | 5.6 | 9,365 | 8,763 | 3.4 | (2.2) |
| Profit after tax | 3,879 | 3,683 | 2.6 | 918 | 739 | 11.4 | 8.8 |
CAGR OF CSC COMPANIES AGAINST CNX 500 INDEX FOR THE PERIOD APRIL 01, 2012 TO 31 MARCH, 2015 (INDIAN RUPEES BILLION)
Challenges Facing Shari’a-compliant Equity Market in India
The major challenges facing Shari’a-compliant equity market in India are as follows:
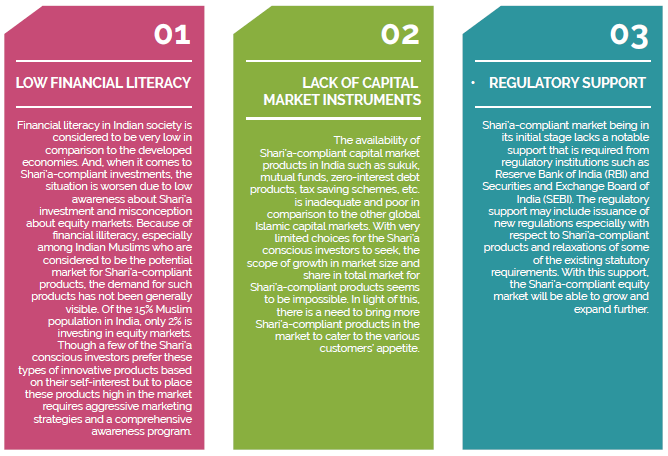
Low financial literacy
Financial literacy in Indian society is considered to be very low in comparison to the developed economies. And, when it comes to Shari’a-compliant investments, the situation is worsen due to low awareness about Shari’a investment and certain misconception about equity markets. Because of financial illiteracy, especially among Indian Muslims who are considered to be the potential market for Shari’a-compliant products, the demand for such products has not been generally visible. Out of the total population, only 2% is investing in equity markets and in Muslim population, it is even low. Though a few of the Shari’a-conscious investors prefer these types of innovative products based on their self-interest but to place these products high in the market requires aggressive marketing strategies and a comprehensive awareness program. ŀŀ Lack of capital market instruments
The availability of Shari’a-compliant capital market products in India such as sukuk, mutual funds, zero-interest debt products, tax saving schemes, etc. is inadequate and poor in comparison to the other global Islamic capital markets. With very limited choices for the Shari’a-conscious investors to seek, the scope of growth in market size and share in total market for Shari’a-compliant products seems to be impossible. In light of this, there is a need to bring more Shari’a-compliant products in the market to cater to the various customers’ appetite.
Regulatory support
Shari’a-compliant market being in its initial stage lacks a notable support that is required from regulatory institutions such as Reserve Bank of India (RBI) and Securities and Exchange Board of India (SEBI). The regulatory support may include issuance of new regulations especially with respect to Shari’a-compliant products and relaxations of some of the existing statutory requirements. With this support, the Shari’a-compliant equity market will be able to grow and expand further.
Conclusion
The opening up of the Indian economy and improving global competitiveness has placed India on the economic radar of global players as the world’s economic center of gravity is slowly shifting away from the established, wealthy economies to the emerging economies including India. The Islamic finance industry has grown considerably over the last decade primarily due to internal demand and external supply. Being a country with the second largest Muslim population in the world, India has one of the largest untapped market with huge demand for Shari’a-compliant financial products and services. Furthermore, the long-term outlook for the Indian economy is very bullish and the Shari’a-compliant index will be a huge booster to attract a new class of investors, especially Islamic and other socially responsible investors from the Gulf, Europe and South-east Asia. Having analysed the performance of the Shari’a-compliant equity market in India from various dimensions, it can be concluded that being in its initial stage in India economy, the Shari’a-compliant equities share a notable percentage of the overall capital market. In terms of growth, as seen in the above paragraphs, the Shari’a-compliant companies on selected parameters are performing better than the total universe. Though the growth of Shari’a-compliant equities in India is not in line with the rate at which the global Islamic finance market is growing (i.e. 15%-20%) but if the challenges are dealt with properly then it can be expected to grow with the same double-digit growth rate.
