

The rapid growth of Islamic finance in general and Shari’a-compliant stocks, in particular, arises the question of whether Islamic funds/ stocks have a better performance or if there is no significant difference with the performance of their conventional counterparts. We conducted a study to compare the performance of Islamic and conventional stock market indices in Turkey, namely KATILIM 50 and BIST100 by using Two-Sample Test of Hypothesis from May 15, 2015 to December 31, 2016. We also examined the causal relationship between both stock market indices in the short-run using Granger (1969) Causality Test.
The findings of parametric Z-test revealed that there is no statistically significant difference between the performance of both indices namely KATILIM 50 Index and BIST 100 Index during the time frame of the study. Further, the Granger Causality findings indicates an absence of a causal relationship between the two stock market indices in the short-run. This suggests that the stock market in Turkey is informational efficient and non-violated with the Efficient Market Hypothesis concerning the available information of both indices. The findings of this study, therefore, provided a useful channel for Muslim investors to participate in the Turkish capital market by investing in Participation İndex and fulfil their religious beliefs without sacrificing any financial performance. The findings of this study, therefore, provides relevant input for investors and policymakers to further support the development of Islamic stock market as an alternative investment choice.
The first Islamic Index was established in the Dow Jones Market in December 1995 to enable Islamic fund managers to list businesses in the capital markets. Since its establishment, investment in Islamic stocks has experienced remarkable growth. According to a 2011 report by the consulting firm PricewaterhouseCoopers (PwC), Shari’a-compliant funds grew at an annualised rate of 26% in the first ten years of this century. The report further states that “an inflextion point” in their growth occurred between 2002 and 2003 when petrodollar liquidity multiplied and capital markets in the Gulf Cooperation Council countries matured to enable investment.
A report by the Malaysia Islamic International Financial Center states that total global Islamic assets under management were USD70.8 billion at the end of the first quarter of 2017. Consequently, various capital markets and financial institutions around the world have now established their Islamic indices. For example, the Kuala Lumpur Stock Exchange Shari’ah Index (KLSESI) introduced by Bursa Malaysia (the Malaysian Stock Exchange) is considered to be an important mechanism of promoting the accomplishment of the Islamic capital markets plan. According to Walkshäusl and Lobe (2012) , Shari’a-complaint assets are in excess of USD939 billion worldwide and over 600 Islamic funds are available, thus investors are shifting their assets from actively managed mutual funds to passive index-based investments. Islamic investment is based on Shari’a principles, that is, it prohibits activities with elements of usury (riba), gambling (maisir), and ambiguity (gharar) and also prohibit activities like producing products or delivering services, which are against Islamic teaching such as pornography, producing/selling alcohol, casino etc. Therefore, all Islamic financial products listed in the Islamic Index need to be Shari’a-compliant and different additional are sometimes used in screening the permissible companies as well.

In Turkey the Shari’a-compliant stock market has experienced rapid growth in the past few years and currently continues to grow at a fast pace. In a dual capital market system, typical of the Turkish stock market or Borsa Istanbul, where the Islamic and the conventional stocks are operated and traded, investors have flexibility in their investment choices. Participation 30 Index (Index Code: KATLM) and Participation 50 Index (Index Code: KAT50) are Stock Indexes comprised of shares of subsequently Top 30 and Top 50 companies with the biggest public market capitalisation traded at Borsa Istanbul National Market and compliant to Shari’a principles. Selection of shares is based on Shari’a-compliant Index Rules and lists companies, which are not active in the field of interest-based activities, alcohol, gambling, pork, entertainment etc.
Moreover, companies are required to achieve some financial ratios to take part in the index. The rate of total interest-bearing debt of companies to market capitalisation shall be less than 30%; the rate of interest-bearing cash and securities to market capitalisation shall be less than 30% and the rate of income from the above-mentioned fields to total income shall be less than 5%. On the other hand, BIST Stock Indices have been created to measure the price and the return performances of a group of stocks traded on Borsa İstanbul.
BIST 100 Index (Index Code: XU100) is a capitalisation-weighted index composed of National Market companies except for investment trusts. The constituents of the BIST National 100 Index are selected based on predetermined criteria directed for the companies to be included in the indices. Existence of a Sharia-compliant stock market gives the Muslim investors a choice of an alternative investment, which is in line with the Shari’a rules and principles. Hence, the Islamic stock market investment in Turkey is considered an alternative investment window through which Muslim investors can participate in the stock market with a religious conscience. However, there still exists an argument among investors whether the performance of Shari’a-compliant stocks is better compared to their conventional counterparts.
In this study we compared the performance of Participation 50 Index, which represents top 50 companies with the biggest public market capitalisation and do business in compliance with Shari’a rules, and therefore aims to compare the performance of Shari’a-compliant stocks versus conventional stock market indices represented by BIST 100, to assist investors in making investment decisions and creating an optimal portfolio diversification investment strategy in the Turkish stock market. In other words, the study aims to examine the application of portfolio theory in the context of the Turkish stock market.
GRAPHICAL ANALYSIS FINDINGS
The purpose of conducting graphical analysis in this study was to figure out and understand the behaviour and movement of both indices namely KATILIM 50 and BIST 100 whether there is a positive or negative association. Furthermore, it is interesting to have a deep understanding of the behaviour of stock market indices since stock index can provide investors with a good idea of how the overall stock market or a certain portion of the stock market is performing. Understanding the market index behaviour can also be useful for measuring the performance of one’s portfolio against a specific benchmark.
Figure 1 displays the movement and performance of both indices in Borsa Istanbul, which indicates that the overall performance of both indices is negative during the time frame of this study. KATILIM 50 and BIST 100 indices sharply dropped by almost 15000 points between May 2015 to November 2016. As the KATILIM 50 and BIST 100 indices were traded at 35000 points on May 15, 2015, to almost 20,000 points by the end of November 2016.
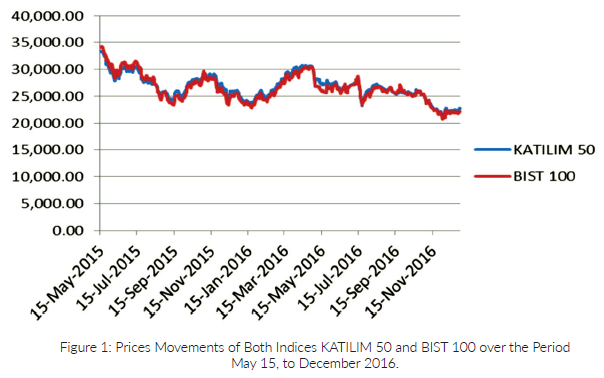

This might be attributed to the internal and external political crises. These challenges may give a negative effect on the country’s local stability and the investment environment as a whole, including the stock market.
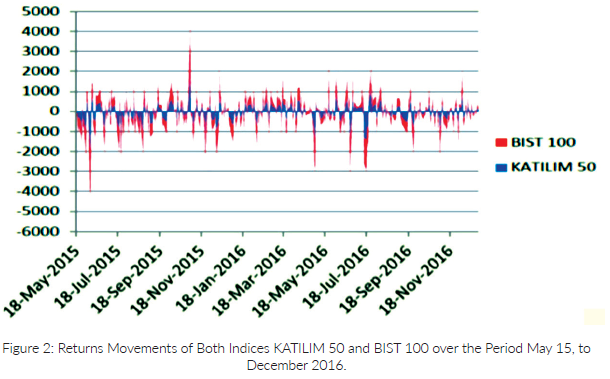
Figure 2 displays the dynamic volatility of both stock market indices’ returns, which indicates that the return of the BIST 100 index was more volatilized than KATILIM 50 index. In other words, KATILIM 50 index exhibits more stability than the conventional BIST 100 index. The highest increase in the dynamic negative volatilities was marked during July 2016, which may be due to the risk of a domestic political crisis that resulted in panic among investors, resulting in return reduction and more volatile and unpredictable behaviour for future stock market returns in Turkish stock market.
THE PAIRWISE GRANGER TEST FINDINGS
Table 1 presents the findings of the Pairwise Granger causality test between KATILIM50 and BIST100 indexes for different levels of lags such as daily, weekly, monthly and quarterly.
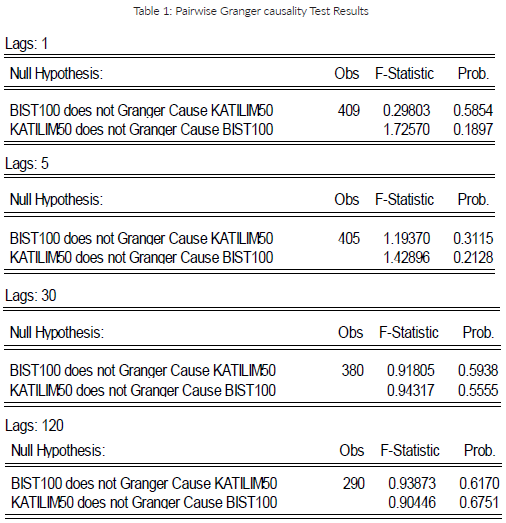
The findings indicate that the KATILIM50 and BIST100 do not Granger cause one another in the short-run during the study time frame. This means KATILIM50 and BIST100 are independent in the perspective of prediction in Turkey capital market. The non-existence of a relationship between the KATILIM50 and BIST100 in the short-run is perhaps due to companies’ underlying business. One possible concept that can be drawn from this finding is that the stock market in Turkey is informationally efficient and showing the proof on the Efficient Market Hypothesis with respect to predictable behaviours between the Islamic and conventional stock indices. In other words, the value of both indices (KATILIM50 and BIST100) cannot be predicted using the available information in the short-run.
TWO-SAMPLE TEST OF HYPOTHESIS FINDINGS
Despite the study having investigated the behaviour and relationship between the KATILIM50 and BIST100 indexes in Turkish Stock Market, investors still need such information about the performance of both indices to make the right investment choice and decision, resulting in creating an optimal portfolio investment. To this end, the study conducted the Two-Sample. Test of Hypothesis to compare the performance of two indices. Table 2 presents the Z-statistic test findings, which has a value of 0.097146156 that is less than the critical value of the two tails, which is 0.922610327. Therefore, the study cannot reject the null hypothesis that advocates there is no difference between the Islamic stock market return (KATILIM 50) and the conventional stock market return (BIST 100) in Turkish capital market at the significant level of .01.
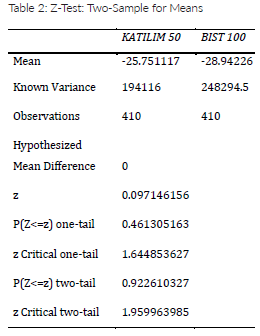
The findings of the Z-statistic of Two-Sample means in Table 2 suggest that there is sufficient evidence that both Islamic and conventional stock market indices have the same capital gain and degree of performance in the Turkish capital market. This finding, therefore, will offer Muslim investors an alternative channel to participate in Turkish capital market using Islamic investment instruments, such as KATILIM 50 index that is in line with Shari’a Principals, to fulfil their religious faith and achieve the same return that is offered by the conventional counter-party.

CONCLUSION
This study utilised the Two-Sample Test of Hypothesis to compare and investigate the performance of KATILIM 50 index and BIST100 index in Borsa Istanbul throughout May 15, 2015, to December 31, 2016, using daily frequency data. Further, the study also examined whether both indices have cause and effect relationship during the same time frame of the study using the Pairwise Granger (1969) Test.
The overall findings show that both KATILIM 50 and conventional BIST100 indexes have no differences in their return and the level of performance. This finding suggests that investors can invest in both indexes however, as for Muslim investors it is difficult to participate in conventional indexes with non-Shari’a-compliant features. Thus, this finding suggests that Muslim investors may consider Islamic indexes which are Shari’a-complaint to satisfy their religious beliefs and achieve the same level of returns with Conventional counter-part. Besides, the result of Granger (1969) Test showed the absence of causality between both indices. This suggests that the stock market in Turkey is informationally efficient and non-violated with the Efficient Market Hypothesis with respect to the available information of both indices.
The policy implications that can draw from the findings of the study are twofold. Firstly, the evidence of absences causal association between both market indices may have a significant impact on investors’ portfolio diversification investment opportunities. Secondly, the evidence of equality in terms of capital gain and degree of performance for both indices would provide relevant inputs to further support the development of a vibrant Islamic stock market as a potential alternative to the current conventional counterparty.
